

It’s official: messing with unions messes up the middle-class
Isn’t this common sense? A new study released Friday by the Centre for Policy Alternatives shows union coverage has a concrete relationship with inequality and the health of Canada’s middle-class. The study finds that individuals and families with someone represented by unions are “far more likely to find themselves in the middle and upper-middle class.” […]
Isn’t this common sense?
A new study released Friday by the Centre for Policy Alternatives shows union coverage has a concrete relationship with inequality and the health of Canada’s middle-class.
The study finds that individuals and families with someone represented by unions are “far more likely to find themselves in the middle and upper-middle class.” On the flip side, the study notes the “decline of union density in the private sector” lines up with “trends in income inequality.”
As CCPA explains, following the Great Depression and the Second World War, unionization soared in North America and Canadian workers saw their weekly earnings more than double by 114%. “The gains of that economic growth were more evenly shared among all workers” and “the gap between the rich and everyone else narrowed.”
But beginning in the early 1980s and accelerating in the 1990s, the decline of union coverage in the private sector “coincided with a period of stagnation in median real incomes” and “the worsening of income inequality” — “incomes rose at the top of the income distribution, but not in the middle or below.”
The chart below shows that as union coverage declined in the 1990s, Canada’s Gini Coefficient (that’s a commonly used measurement used to track income inequality) began to rise:
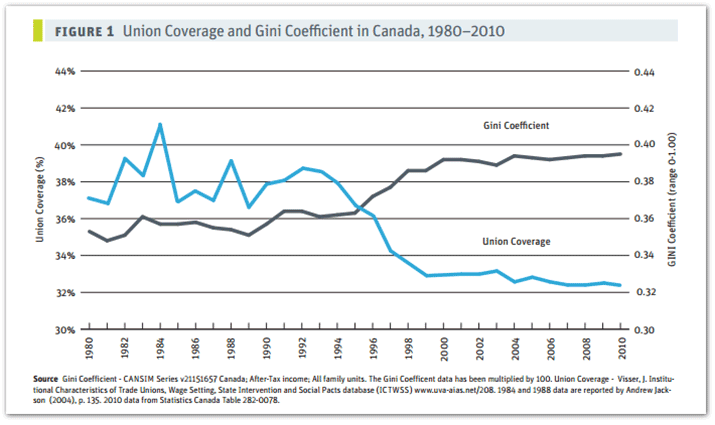
So what happened to Canadian incomes after union coverage began to decline in the 1990s?
- The richest 10% accrued 48% of all inflation-adjusted income growth in the country.
- The richest 5% accrued 35% of all income growth.
- The richest 1% accrued 18% of total growth.
- And the bottom 50%? They only got 7%.
Between 1997 and 2011, union density in the private sector dropped from 21% to 14%, with most of the decline taking place among middle and upper-middle class workers.
CCPA notes that between 2006 and 2011, workers who lost union jobs saw their median incomes drop by 9% while workers who gained union representation saw their median incomes rise by 39%:

Photo: X Ray Delta One. Used under Creative Commons license.
Our journalism is powered by readers like you.
We’re an award-winning non-profit news organization that covers topics like social and economic inequality, big business and labour, and right-wing extremism.
Help us build so we can bring to light stories that don’t get the attention they deserve from Canada’s big corporate media outlets.
Donate